
With presence in 175 countries, over 820,000 service and merchandise vendors, and more than 62 mln. customers, Shopify is a major holder of eСommerce flow and consumer data. The company utilized the wealth of information at its disposal to deliver its first State of Commerce report in June 2019, featuring valuable insights into purchasing trends around the globe.
Shopify researchers investigated into the platform’s global sales from April 2018 till April 2019, conducted an online merchants’ survey, and polled Canadian and US consumers. This article highlights major findings—i.e., behavioral patterns behind consumer choices, seasonal demand fluctuations, nation-specific shopping contexts, and sales channel statistics. Some of the most important takeaways are as below.
Table of Contents
Customers Demonstrate Increasing Loyalty
According to the report, buyers tend to return to the same vendor when they are satisfied with the quality of goods or the brand they’ve chosen. At least, over half of respondent shops claim so. In all, 14%, or 62 mln. consumers, have actually purchased from the same store or brand more than once.
A global merchants’ survey shows that Japan leads by the number of such recurrent purchases. An overwhelming majority of North American respondents (73%) are ready to stay loyal to a particular label, should it be up to their quality expectations.
Shopping Rates Have a Seasonal Touch
Black Fridays, Cyber Mondays, and other major shopping events associated with holidays rule seasonal demand in an obvious way. In most respondent countries, the highest shopping season lasts from November until late December. The smallest sales volumes are recorded in February, except for the week around St.Valentine’s Day.
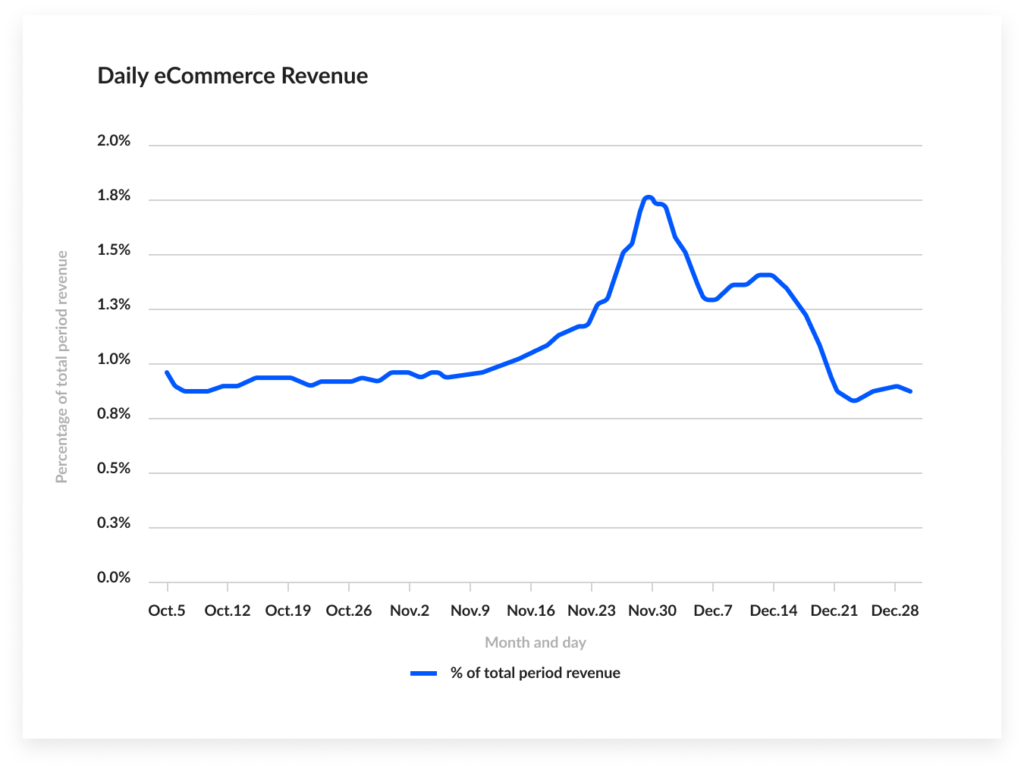
The report also revealed a steep increase in demand levels beyond the obvious ‘holiday hectic’ trend. Apart from November and December, shops operate at highest turnovers in January, which is most likely due to carry-over selloffs and overstock situations. Another probable reason for the unexpected purchasing spikes is opening of new stores, typically scheduled on the first dates after the New Year’s Eve.
Buyers are Likely to Behave in One of Four Ways
As evident from the North American survey data, shoppers demonstrate distinct behavioral patterns, enabling to identify the following general categories of them:
- Trend Trackers make the least predictable shopping crowd, amounting to 28% of respondents. Their choices are mostly random, based on inner motivation, and hardly influenced by any particular e-marketing strategies. Overall, their contribution to the sales proceeds and databases of eСommerce stores is minimal because they are unwilling to either share their personal data or spend money online.
- Savvy Searchers know how to browse their way through all the multitude of online deals with any digital gadget. As a rule, consumers in this category conduct thorough Internet research before actually making a purchase. Quality is a kink for the type.
- Engaged Explorers are driven by the motivation to indulge themselves, finding new offers. Though demonstrating quite a consistency about their choices, they are ready to widen the scope of shopping opportunities, mostly based on recommendations. The category are also most likely to post useful recommendations and reviews online.
- Pragmatic planners are the most numerous group of online shoppers, making about 31% of respondents. The type are conservative about their choices, standing by familiar and trusted vendors and labels. On the other hand, they are less than enthusiastic about shopping as leisure. Therefore, whereas such buyers make decisions to purchase while searching online, they prefer one-stop shopping at physical store locations.
The categorization can be useful when building e-marketing strategies and understanding the motivation behind buyer behavior. The figure below is a short summary of the consumer types discovered in the course of the research.
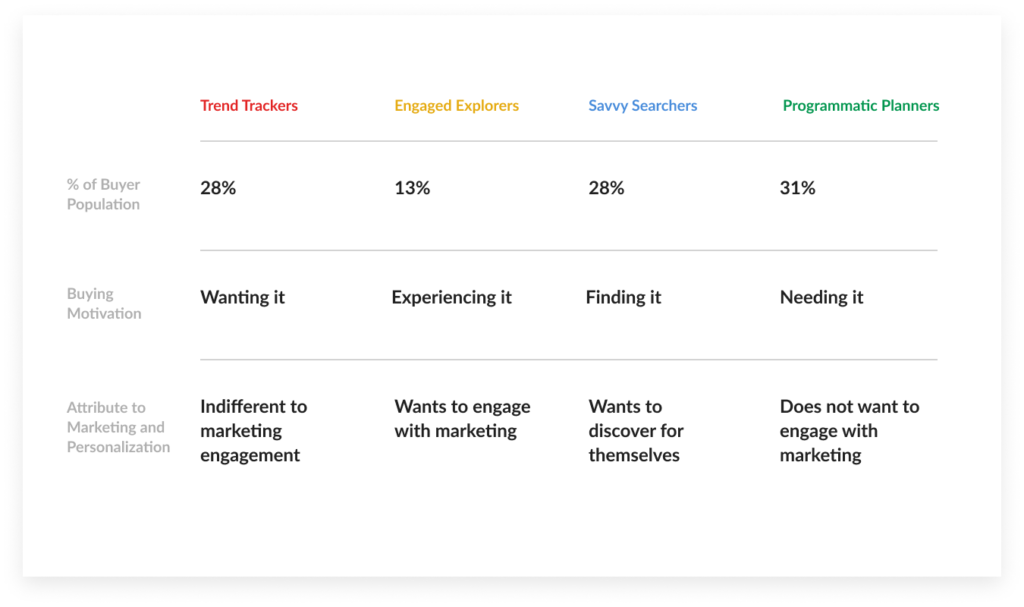
Image source: Shopify state of commerce report 2019
Purchasing Patterns Vary from Nation to Nation
In general, reported figures show that online shopping is becoming increasingly popular. Another tendency is for customers to visit the same eСommerce venue for regular purchases. Based on the research data, certain country-specific online shopping trends are also evident.
How much and how fast consumers buy
Americans are more generous when shopping, buying the double on shoppers from all the other respondent countries. Germans are the fastest about making online shopping choices—17.68 minutes on average, whereas Singapore citizens are the slowest, deciding within 28.23 minutes.
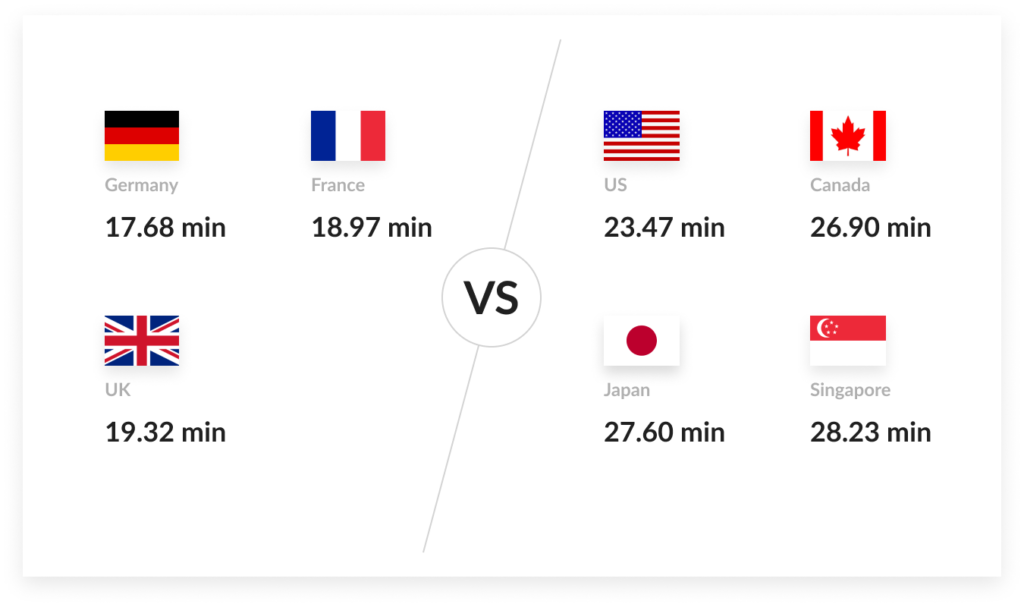
Image source: Shopify state of commerce report 2019
Costly vs. cheap purchases
Among the surveyed nations, the Japanese are reported to make the most expensive transactions amounting to 141.72 USD each, on average. The French is the most thrifty nation, spending as little as 65.04 USD per online deal.
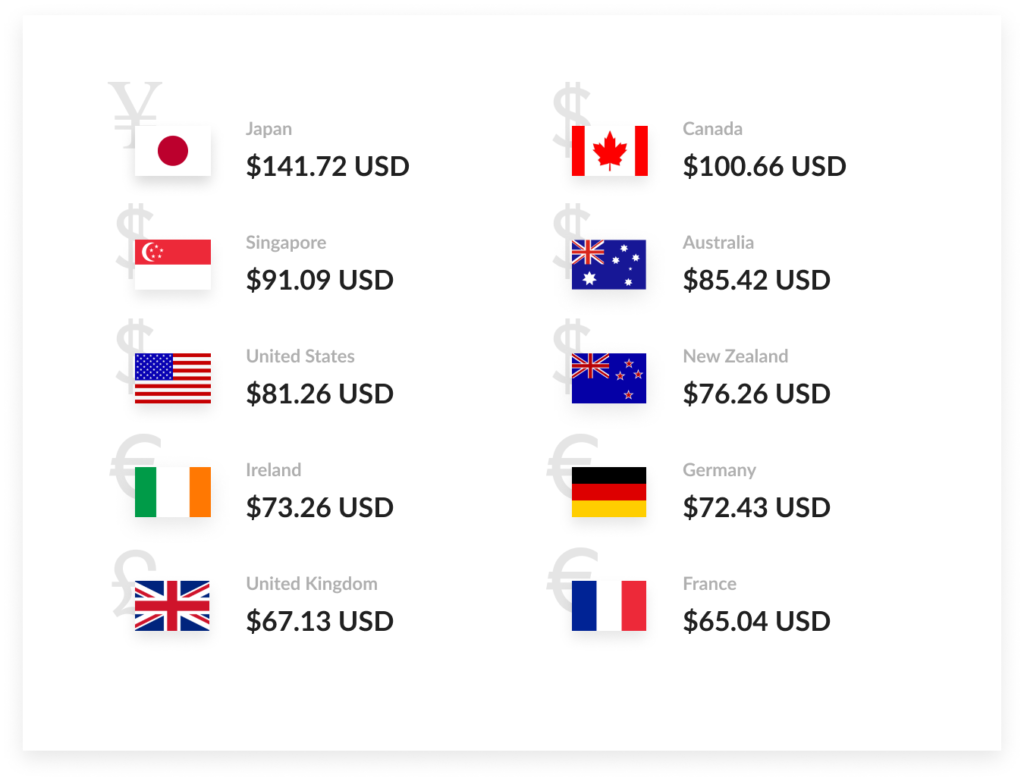
Image source: Shopify state of commerce report 2019
Shopping rush hours
The report identifies such indicators as peak transaction and browsing times. The peak transaction time is when the largest quantity of online shopping deals are closed. The peak browsing time is those hours when online shopping requests are the most numerous.
In North America, the peak transaction hour is around five o’clock, which is probably due to the predominantly nine-to-five lifestyle. The browsing rush hour in the same country is at midnight. A survey on Canada demonstrated a bit different result—peak transaction time at 5 p.m. and the busiest browsing hour at 8 p.m. In general, the motivation behind both online window-shopping and purchasing is to relax or to let go of the workday troubles.
The variety of buying media
It is also possible to track certain geographical patterns in terms of preferred online shopping media—whether a customer uses a mobile phone, a desktop computer, or a table to buy. The location-specific preferences mostly reflect cultural peculiarities and technological advancement levels.
In Australia, the US, Canada, China, and the UK, the research revealed no material difference in how frequently people use all three gadgets for online shopping. A tablet is the preferred media in Vietnam, Singapore, New Zealand, the United Arab Emirates, Morocco, as well as in such European countries as Ireland, Denmark, and the Netherlands. Indians and Mexicans would rather use desktop PCs than any other means to shop. In Brazil, mobile devices hit the top of the list.
Retail Business Goes Online and Personal
A key finding for sellers or those seeking to launch a sales business is that physical stores are only the second largest revenue channel. EСommerce venues lead in the business game, representing over 80% of sales volumes based on a survey of global Shopify vendors. Social media also play a role, though it is rather about bringing shoppers to discover new offers and opportunities than actually selling anything.
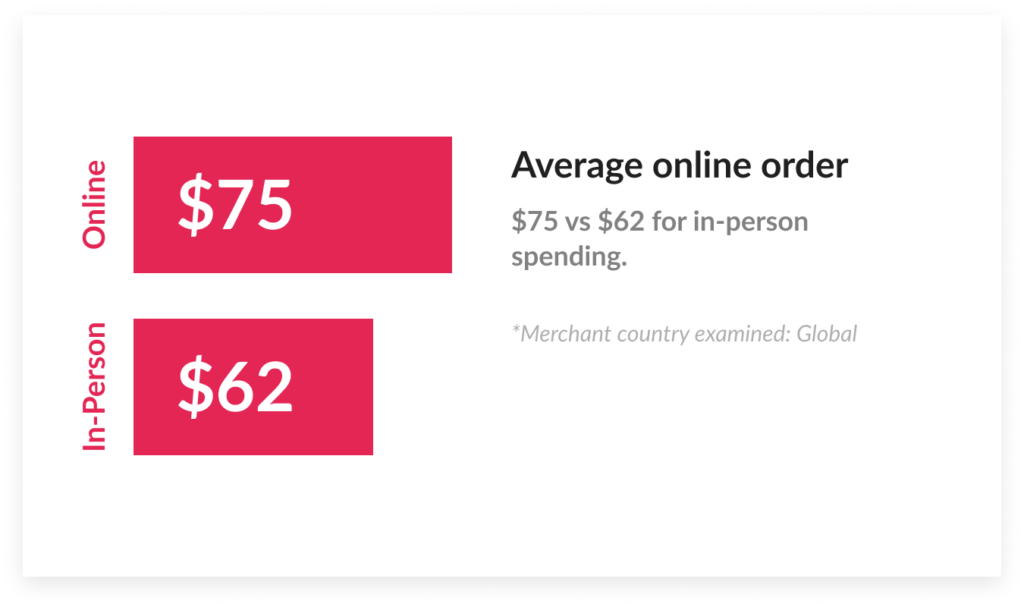
Image source: Shopify state of commerce report 2019
Another important observation is that direct interaction with a buyer and in-person selling are essential prerequisites to a successful retail strategy. Entrepreneurs gain more when they take the risk to run their own business than when operating otherwise—e.g., via a marketplace.
A single-channel approach to managing business proves beneficial in terms of both cost efficiency and customer retainment. The research revealed an increasing demand for the Shopify point-of-sale (POS) service, which is an application enabling to manage both physical and online store from a single platform. The number of vendors using the Shopify POS has increased by 14% as compared to last year.
Major business challenges in retail remain building a marketing strategy and creating a brand, as pointed out by 30% and 22% percent of respondents accordingly.
Merchandise Preferences are Nation-Specific
Though there are some general trends in demand for products, with T-shirts and tops being the highest-ranking items across countries, customer preferences depend heavily on geography. Some interesting observations from the report are as follows:
- In Germany, dance costumes are on the top of the best-seller list, though the same merchandise is hardly ever in the top 50 goods in other countries.
- In Japan, tea, infusion, and knives (4th rank) are more popular than in any other national market.
- In New Zealand, the top-selling merchandise is vitamins.
- France leads in the sales of perfumery and lingerie.
- Bracelet is the highest-ranking accessory globally.
- Almost everywhere, top items on sale include books, shoes, and mobile phone cases.
Conclusion
The takeaways from the Shopify report testify to customers turning more towards eСommerce venues. To a larger extent, for initial research, but online purchasing is on the rise, too. The research is a source of valuable information about customer behavior, as well as geographical and seasonal eСommerce trends. This can help those who run a store already or about to launch a retail business to embrace ongoing transformations, while increasing profit and customer engagement.